First COVID-19 metrics and data visualization for parliamentary constituencies in India.
India has the second-highest number of confirmed cases and ranks third for the greatest number of deaths since September 2020. We present the first COVID-19 metrics and data visualization for parliamentary constituencies in India that allow elected officials and their constituents to monitor and develop testing and vaccine deployment strategies to efficiently enable the reopening of the country.
Citation
Authors: Akhil Kumar, Weixing Zhang, S V Subramanian. Geovisualizing COVID-19 Metrics across Parliamentary Constituencies in India. December 2020, Cambridge MA, Harvard Center for Population and Development Studies.
Data
We acquired COVID-19 data from covid19india.org which is a crowd-sourced data site for COVID-19 stats and patient tracing in India. The API can be accessed here. covid19india.org adjusts cumulative deaths occasionally which results in negative daily new deaths. For instance, the cumulative number of deaths in Palghar of the state of Maharashtra was changed from 952 to 876 on November 3, 2020. The negative deaths are changed to zero in our dashboard. Lakshadweep is also not shown in our dashboard because of the lack of data available. The dashboard updates daily at 3pm EST.
Methodology
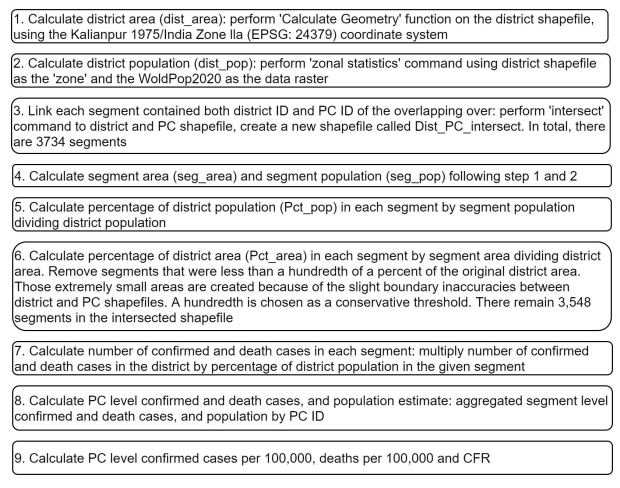
To generate the crosswalk between districts and parliamentary constituencies, we used a type of dasymetric mapping technique that allowed the weighting of the population in each PC assuming the COVID-19 metrics were distributed uniformly across the population in one district. See the workflow below and read the working paper here for more details.

